

You see another headline about AI changing work. Then you start thinking about your own job. Is it safe?
Your job title will only tell you so much. Think about everything you do during a normal week. AI might be able to do one part almost entirely. For another, it may help, but you still make the decisions. So if you want to understand how AI could change your role, you have to look at the work inside it.
The Anthropic Economic Index gives you a way to explore that with data. It analyzes observed Claude usage and connects the work in those conversations to tasks associated with hundreds of occupations. You can see which tasks people already use Claude for and whether they automate the work or stay involved while using it.
That will not tell you whether your job will exist in ten years, but it can give you a clearer picture of what is already happening inside the role, one task at a time.
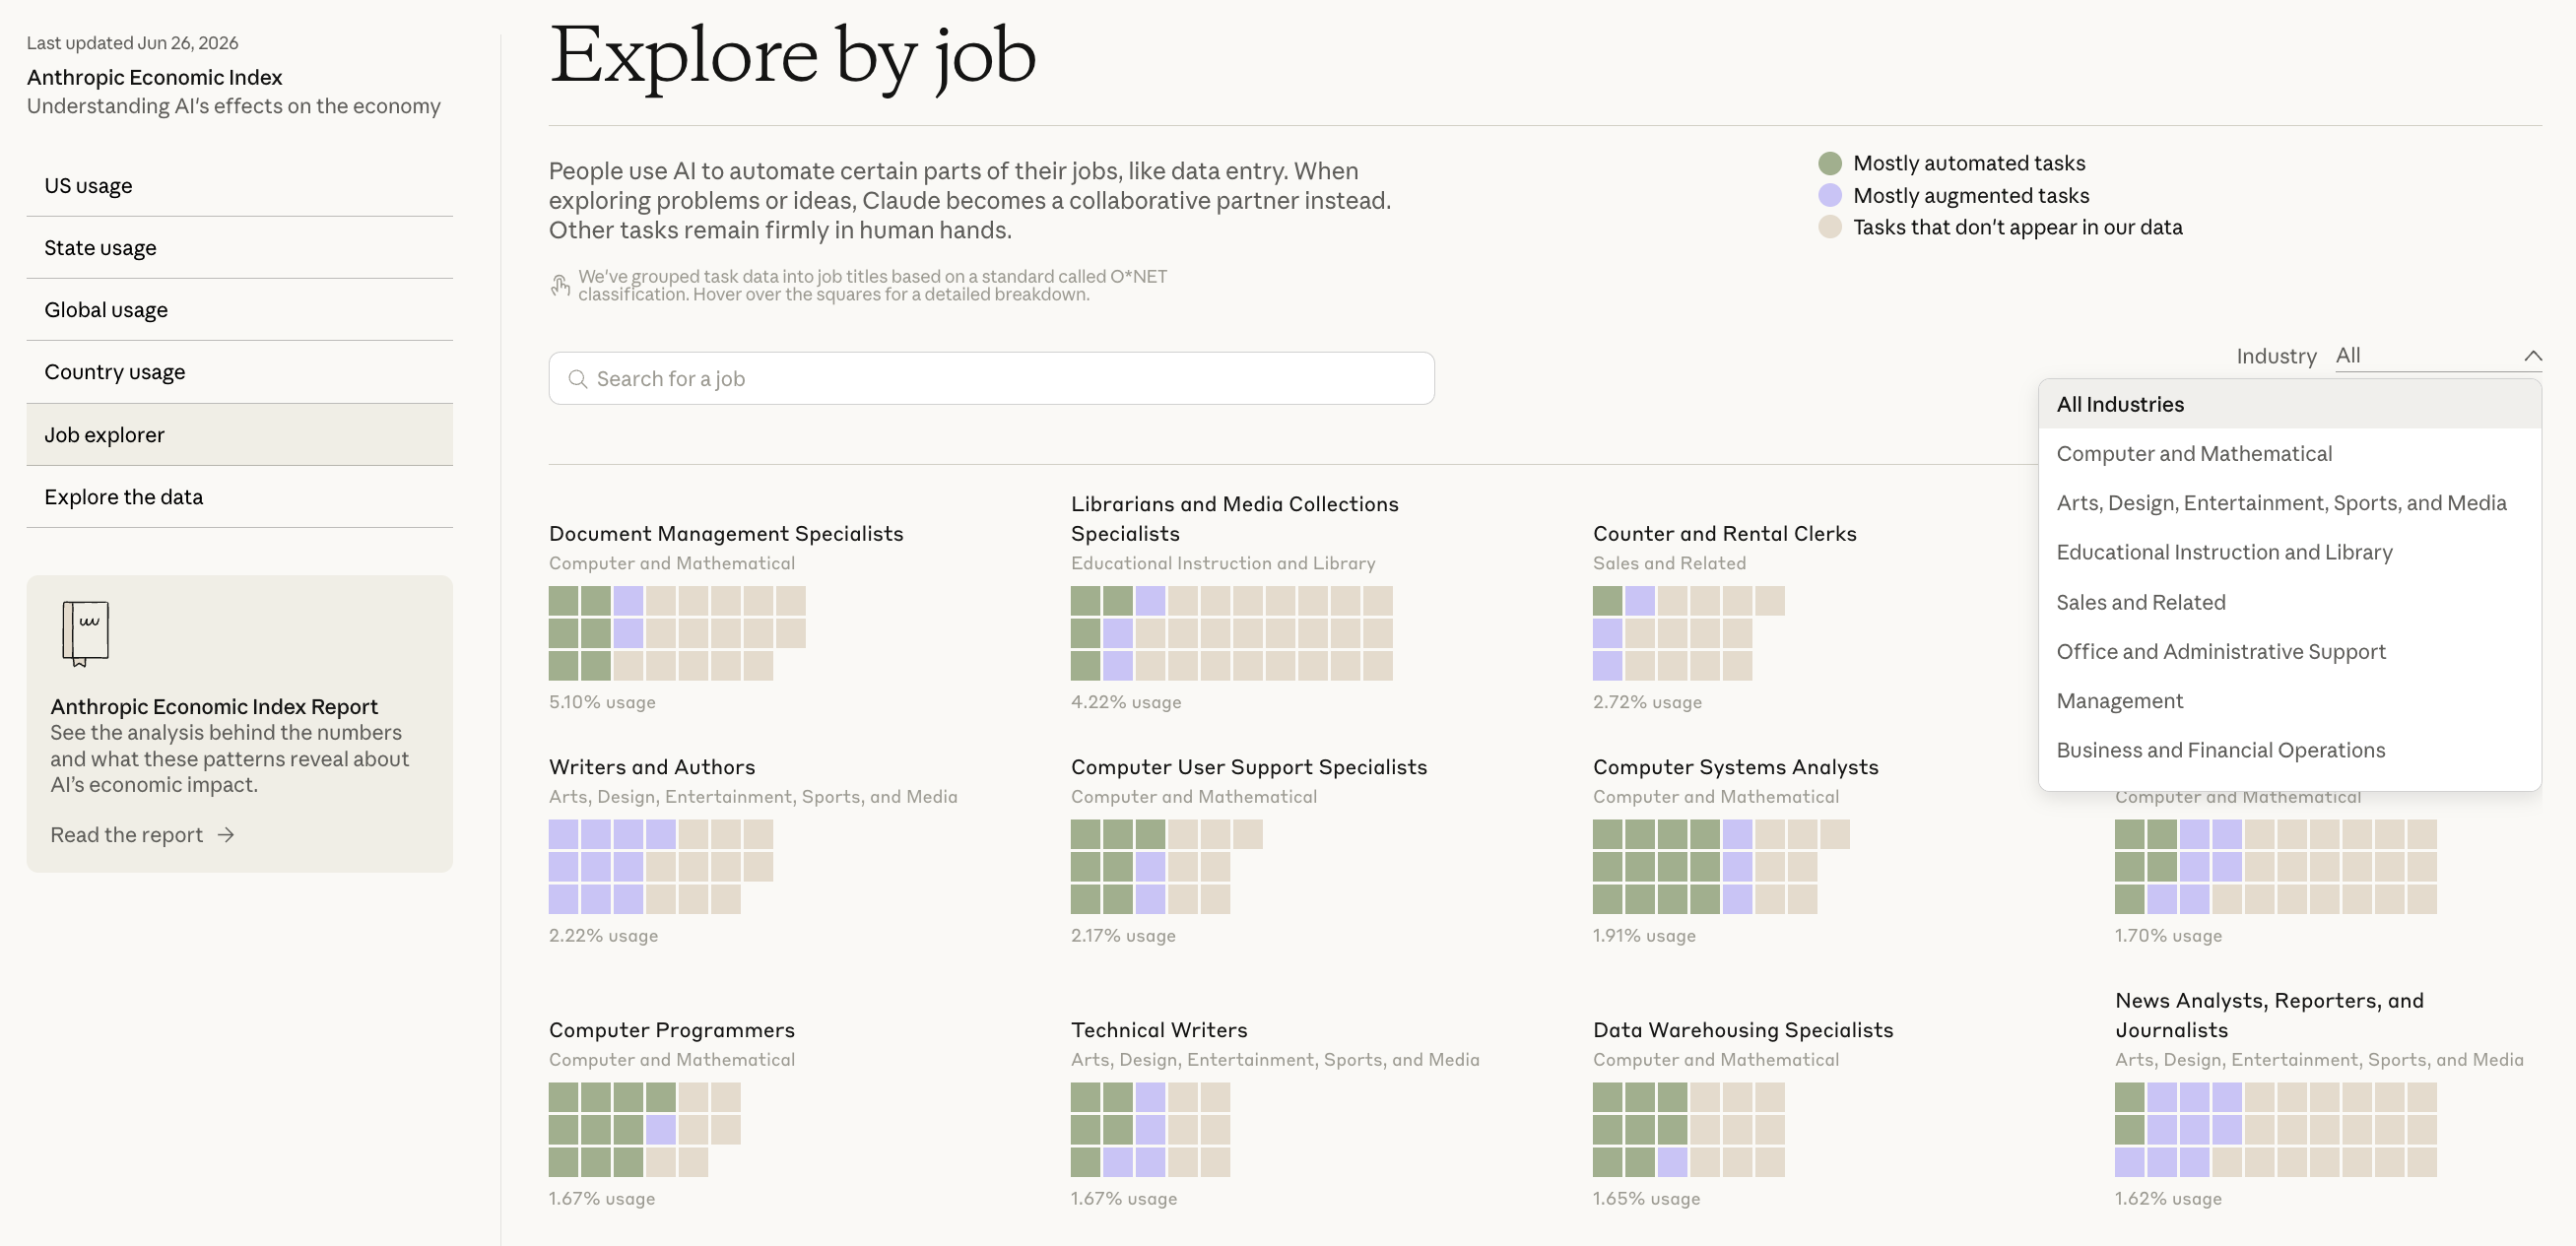
Until recently, asking your own questions of the Index meant downloading the datasets and working through them yourself. But on July 22, Anthropic released the Anthropic Economic Index connector, and now you can ask Claude directly and keep exploring the data with follow-up questions.

The questions you can ask go far beyond understanding your own role. Depending on what you do, you can use the same data to investigate a product idea, plan content or training for a profession, prepare for a client conversation, or decide where AI could be useful inside your team.
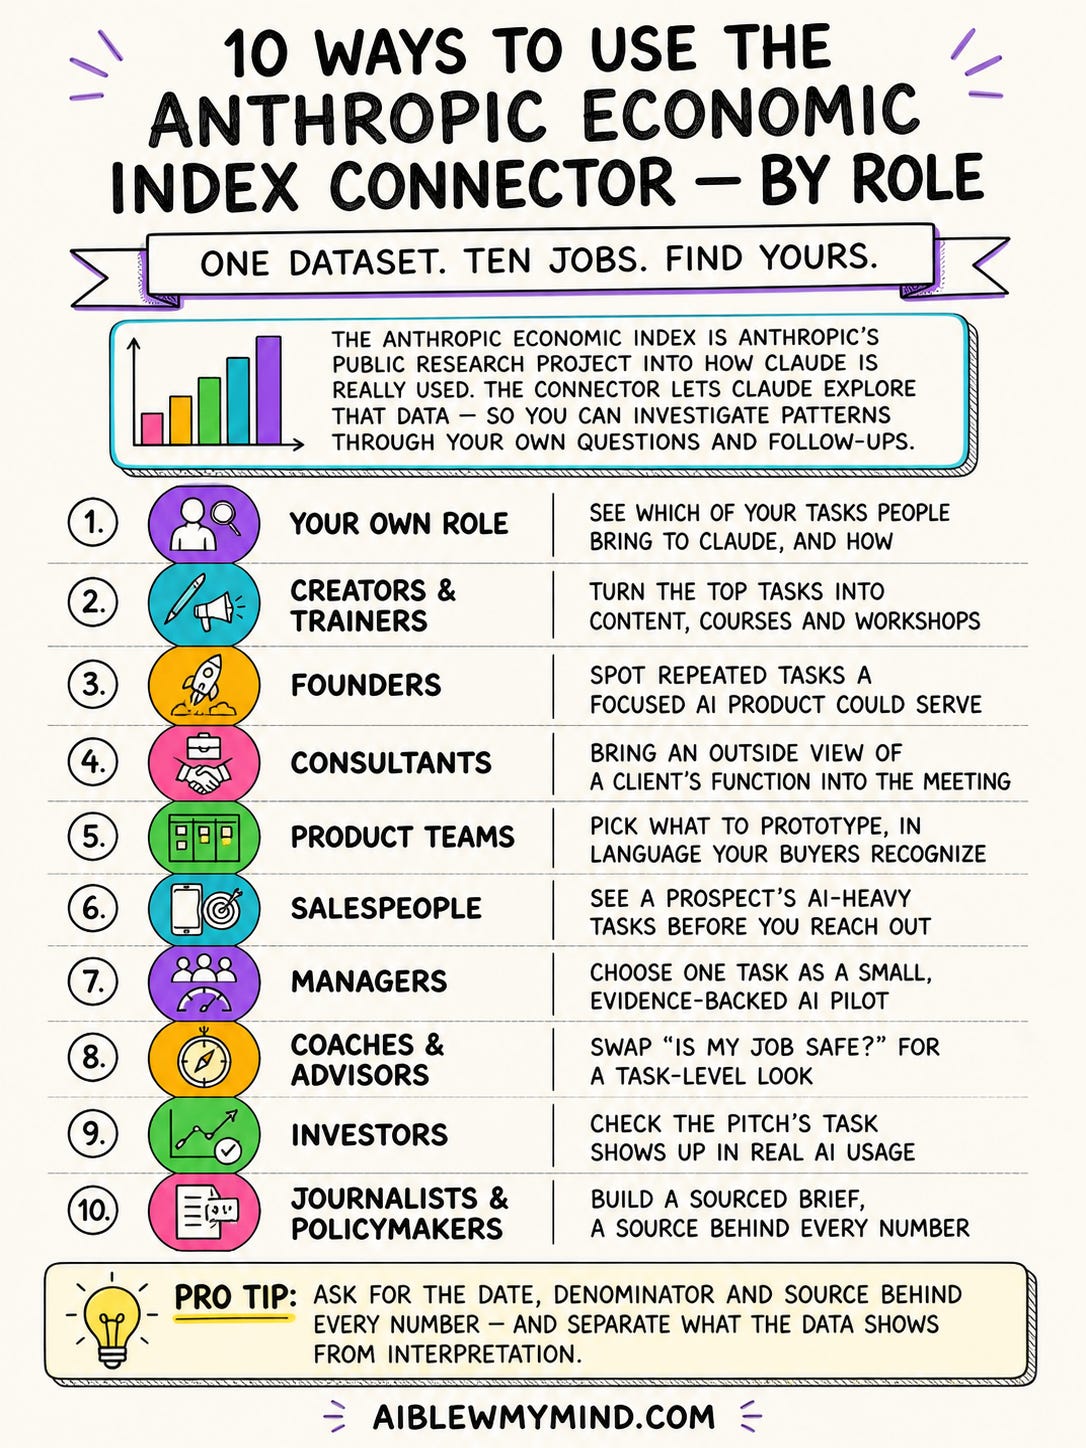
So I put together 10 ways to use the Anthropic Economic Index connector, organized by role. Each one includes several prompts you can copy, change, or combine to explore the questions that matter to your work.
Here is what we are covering
What the Anthropic Economic Index connector is
How Anthropic maps Claude usage to occupations and job tasks
How to enable the connector in Claude
10 ways to use it, organized by role: your own profession, content and training, business and product, consulting and sales, team management, career advice, investing, research, and policy
A short guide to reading the numbers correctly
What is the Anthropic Economic Index connector?
The Anthropic Economic Index is Anthropic’s public research project for studying patterns in Claude usage. The connector gives Claude access to that data so you can explore it through questions and follow-ups.
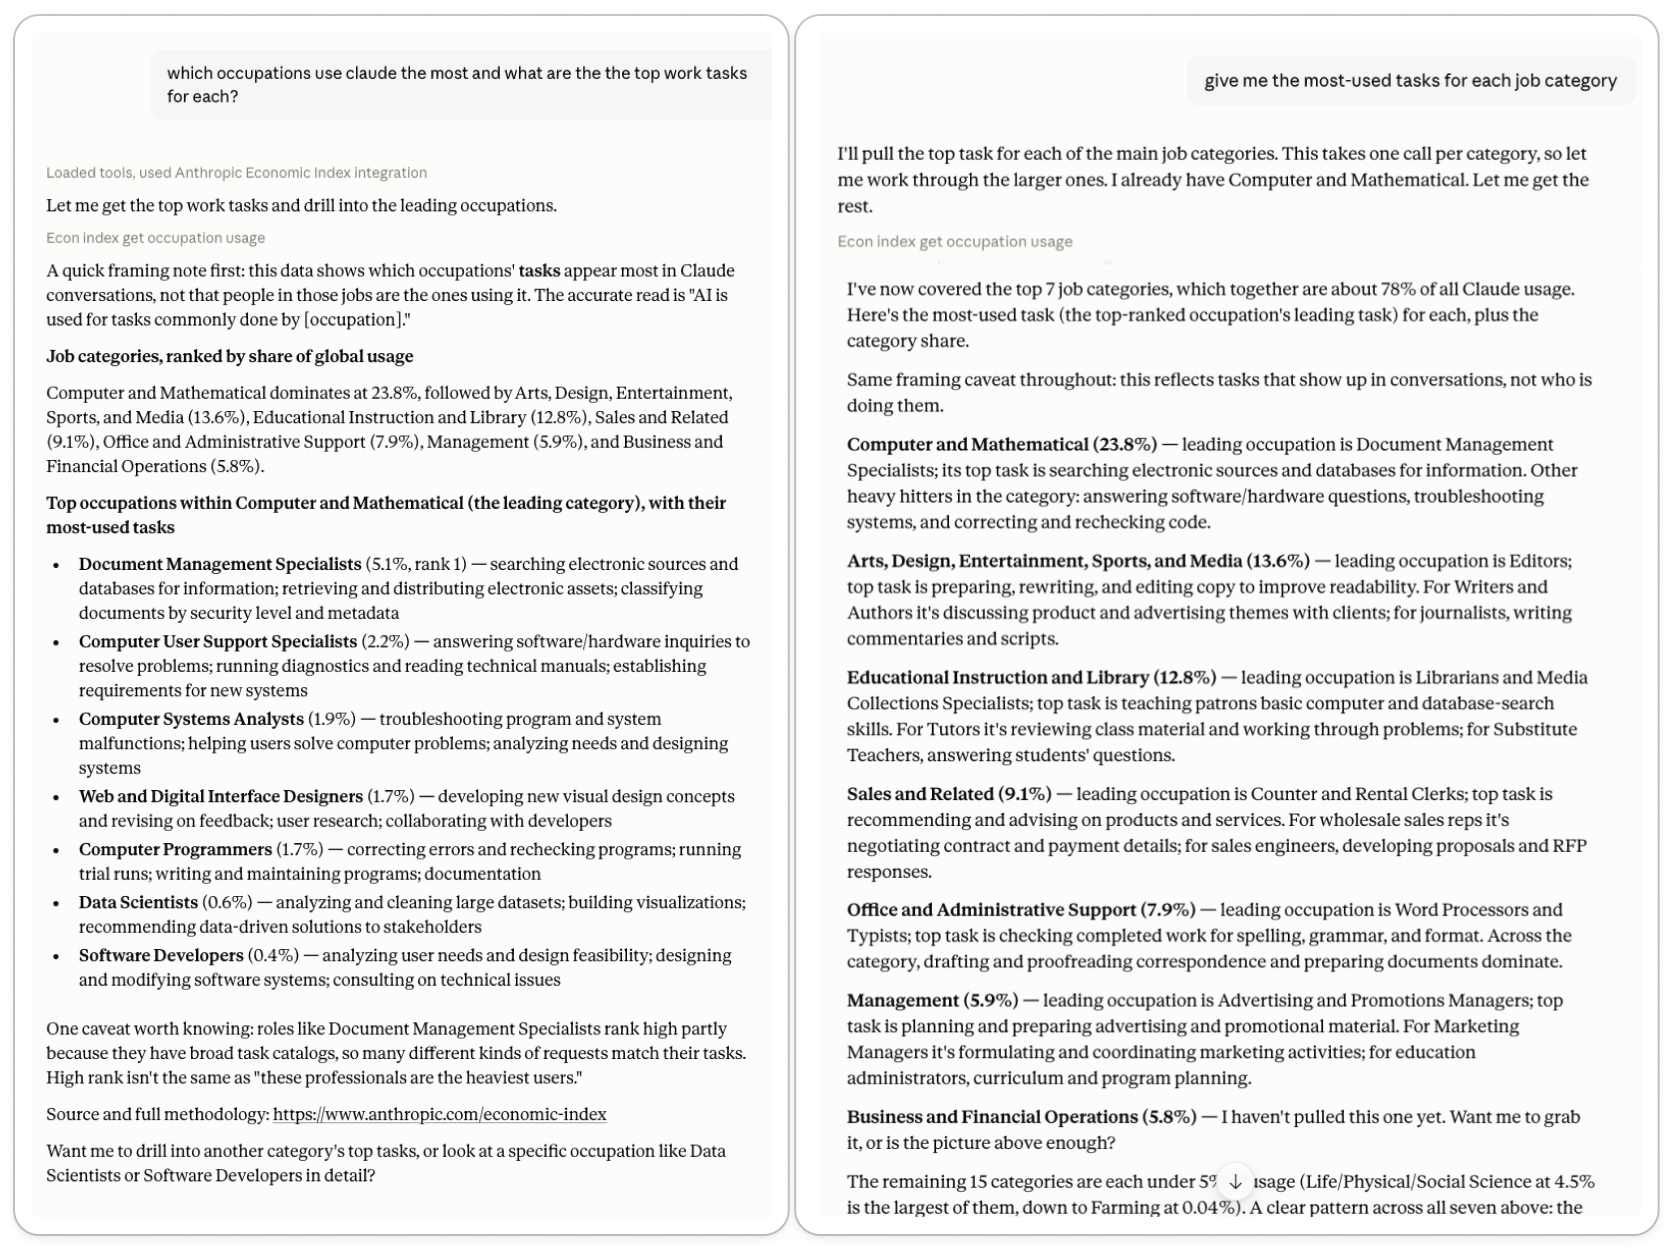
This means you can now ask Claude questions like:
In [profession], which tasks appear most often in Claude usage?
Which tasks in [industry] are people automating with Claude, and which do they use Claude to work through?
Which occupations show the highest Claude usage in [country or US state], and which tasks are driving it?
How have Claude usage and collaboration patterns changed across Economic Index releases?
How Anthropic maps AI use to occupations and job tasks
The Index uses Clio, a privacy-preserving analysis system, to sort large groups of Claude conversations into broad patterns. When a conversation is work-related, it matches the task to O*NET, the US Department of Labor’s database of occupations and the work associated with them.
So a conversation about debugging software, preparing a lesson, or editing a report gets connected to the occupation where that task usually appears.
This is where the job titles can be misleading. If the Index connects a conversation to an occupation, it does not mean someone with that job title started it. It means the work in the conversation resembles a task associated with that occupation. Claude is not secretly checking people’s LinkedIn profiles.
The Index also looks at how the person and Claude worked together. Those patterns are grouped into five types:
Directive (automation): The person hands Claude a task with little back and forth.
Feedback loop (automation): The person gives Claude repeated input from the outside environment as it completes the task.
Task iteration (augmentation): The person works with Claude to refine the output.
Learning (augmentation): The person uses Claude to understand something or build knowledge.
Validation (augmentation): The person asks Claude to check or assess their work.
The same task can appear in several of these patterns. One person might ask Claude to write a report for them. Another might use it to shape the structure, fill gaps, and check the final version.
So when you explore your own role, look at the collaboration pattern beside each task. It shows whether AI is taking work off someone’s plate or changing how the work gets done.
How to enable the Anthropic Economic Index connector in Claude
In claude.ai, follow this path:
Customize → Connectors → Add (top-right corner) → Browse Connectors → Anthropic Economic Index → Add
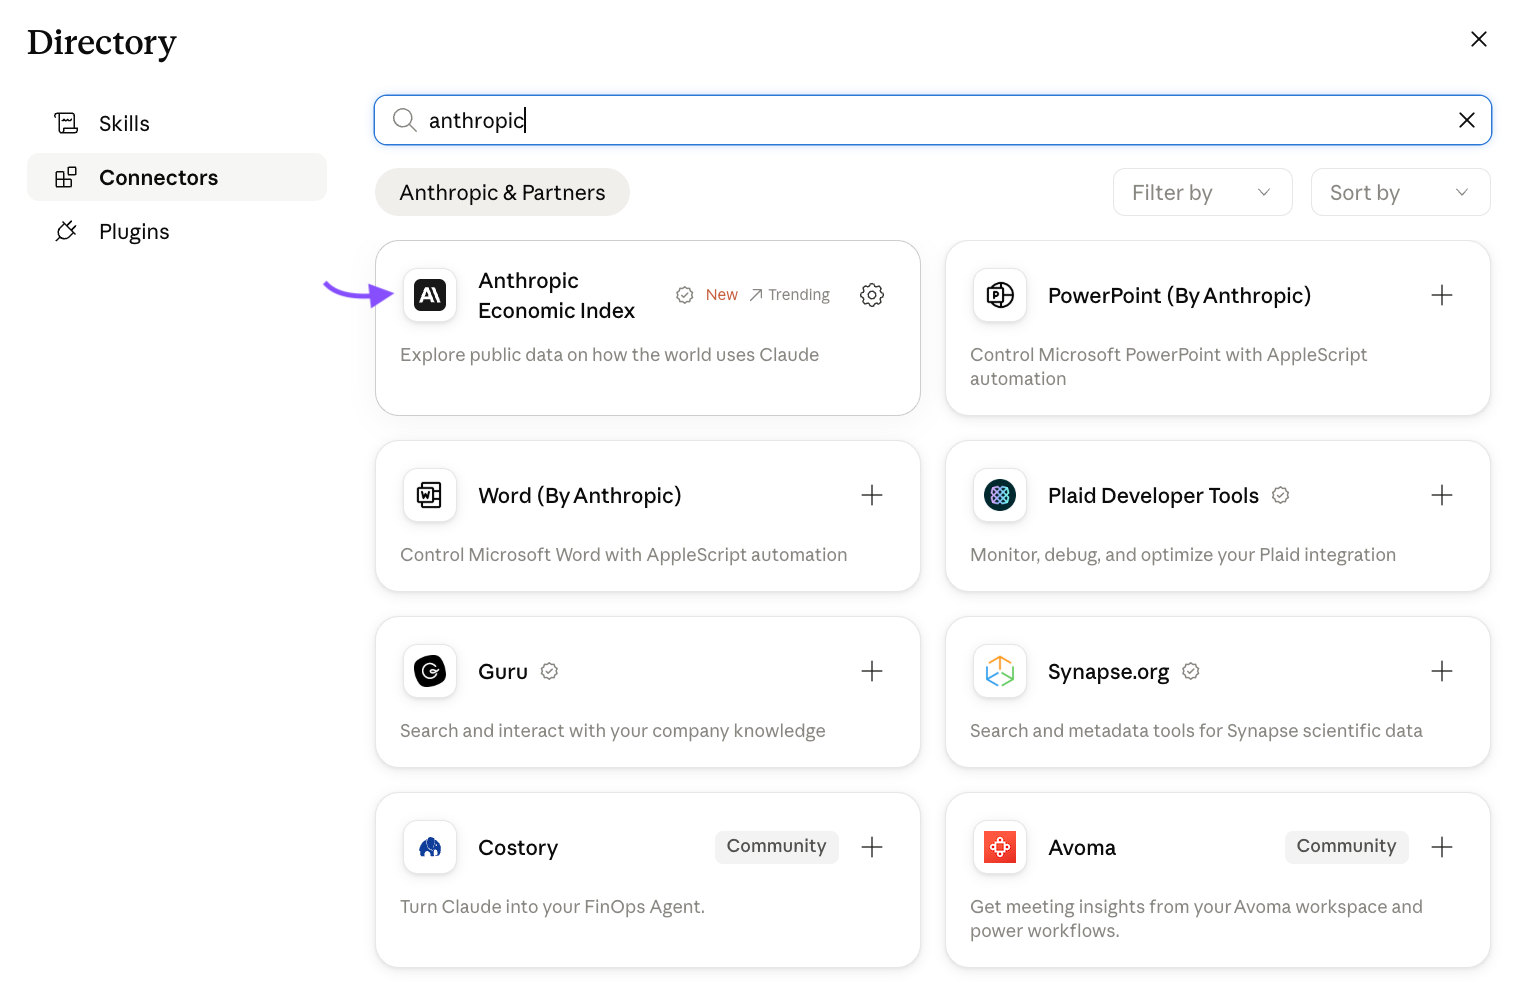
Setup takes about a minute. The useful part starts with what you ask next.
10 ways to use the Anthropic Economic Index connector by role
I organized these examples around the people who read this newsletter. Find the role closest to yours, replace the brackets, and use the questions as inspiration. You can paste one as written, change it, or combine several into a deeper conversation.
For stronger answers, add this sentence to the end of any prompt:
For every number, include the dataset date, denominator, and source. Separate what the Index shows from your interpretation.
1. For your own role: see how people use AI across your job tasks
Start with the work you know best. You will spot a strange result much faster in your own profession than in someone else’s. The connector can show which associated tasks appear most often in Claude usage and whether the interaction looks collaborative or delegated.
Try these prompts:
“I work as a [your role]. Which tasks associated with my occupation appear most often in Claude usage?”
“For [your role], which tasks lean toward automation and which lean toward working collaboratively with Claude?”
“Build me a task-by-task AI profile for [your role], including the tasks with high, low, or no visible usage in the Index.”
2. For creators, publishers, and trainers: build content and courses for a profession
I immediately saw a content calendar hiding in this data. Then the same task list started to look like a course outline. Frequently observed tasks can become role-specific tutorials, interviews, workshops, newsletter topics, or training modules.
Try these prompts:
“Which tasks associated with [profession or audience] appear most often in Claude usage? Turn them into ten content ideas across tutorials, newsletters, interviews, and workshops.”
“Take the ten most-observed tasks associated with [profession] and organize them into beginner, intermediate, and advanced course modules.”
“Find surprising or misunderstood patterns in how Claude is used for tasks associated with [profession]. Turn them into five article angles.”
“For each of the five most-observed tasks associated with [profession], suggest a case-study angle and five questions I could ask someone doing that work.”
“Which tasks associated with [profession] have low observed Claude usage? Could any become useful advanced or experimental training modules? Explain what the data can and cannot tell me.”
“Turn the most-observed tasks associated with [profession] into a four-week content and training series. Include the Index finding behind each idea.”
The Index gives you the angle. A few Amplifiers can take it all the way to a finished piece. Topic Research Workflow checks what already exists before you draft, while Content Repurposer turns one piece into versions for LinkedIn, Substack, X, and email. Carousel Slide Generator and Infographic Generator create the visuals in your brand colors.
Building a course instead? These teaching Amplifiers turn each task into modules, examples, and assessments, while the brand skill keeps your decks and PDFs consistent with your visual identity.
3. For founders: investigate a product idea for a specific profession
Founders, I know where your brain goes next. Mine did too.
When people repeatedly bring the same task to a general AI assistant, it is worth investigating whether a product built specifically for that workflow could serve them better. I’m already using the Index to look for patterns around Amplifiers.
Try these prompts:
“Which tasks associated with [profession] appear most often in Claude usage, and which could support a focused AI product?”
“For [profession], which tasks are automation-heavy and which are augmentation-heavy? What product experience might fit each pattern?”
“Which frequently observed tasks associated with [profession] still involve iteration or validation? What could a product do to support those steps?”
“What kinds of outputs do people request for tasks associated with [profession]? What could that suggest about what the product should create, organize, or help review?”
“I am exploring a product that helps [profession] with [task]. What evidence can the Index provide, and what would I still need to validate with customers?”
This is a research lead, not full market validation. You still need customer interviews and willingness-to-pay evidence.
A few Amplifiers pick up exactly where the Index stops. Find Your Next Business Idea amplifier turns a pattern into a scored opportunity with a 90-day plan. Competitor Research & Tracking Workflow shows who already serves that profession. Pricing Strategy Builder covers willingness-to-pay, the evidence the Index can't give you. And once you commit, Business Name & Trademark Clearance checks the name is safe before you build a brand on it.
4. For consultants: prepare for a client conversation about their function
The connector gives you an external view of the tasks associated with a client’s profession. Bring it into the meeting as a conversation starter, then ask the client where their own experience matches or contradicts the data.
I would pair this with direct account research. My AI prospect research workflow covers the company-specific part.
Try these prompts:
“What are the most visible Claude use patterns for tasks associated with [client’s function]?”
“Based on the Index patterns for [client’s profession], give me five neutral discovery questions about how their work is currently done, where the team loses time, and where AI support might be useful. Do not assume they want to automate anything.”
“Create a one-page briefing on AI use in [client’s profession], with the findings, limitations, and five questions for our meeting.”
5. For product teams: decide what to test and how to position it
If your product serves a specific profession, the Index can help product managers and product marketers work from the same task data.
Product managers can use it to choose workflows worth prototyping. Product marketers can plan campaigns around usage patterns in the countries they market in.
Try these prompts:
“Our product serves [profession] and helps with [product description]. Which associated tasks show the strongest observed Claude usage, and which are closest to what we do?”
“Which tasks associated with [profession] are automation-heavy enough to test a do-it-for-me feature, and which augmentation-heavy tasks could benefit from review, iteration, or learning features?”
“For [task], does Claude usage lean toward automation or augmentation? What product experience and positioning direction could fit the observed pattern?”
“Build a prioritization table for tasks associated with [profession]. Include observed usage, automation or augmentation pattern, product fit, prototype idea, and customer-facing language. Separate Index evidence from your interpretation.”
6. For salespeople: understand a prospect’s function before outreach
Use the data to understand which tasks associated with the prospect’s function appear in Claude usage, then bring a more specific question into the conversation.
Try these prompts:
“What tasks associated with [prospect’s role] appear most often in Claude usage?”
“Which tasks in [prospect’s function] are commonly delegated to Claude, and which involve more collaboration?”
“Based on the Index data for [prospect’s profession], give me five discovery questions that do not assume this person already uses AI.”
The Index gives you context about the role, but it will not find the people worth contacting. That is where three sales Amplifiers fit: Prospect Finder Workflow finds companies and decision-makers matching your criteria, Prospect Research Workflow gives you sourced context on each prospect, and Discovery Call Prep Workflow turns that research into a brief and tailored questions. You go from identifying a relevant problem to knowing who to contact and what to ask.
7. For managers: choose an AI pilot for your team
Use the Index as an outside reference, then compare it with the tasks your team performs frequently, dislikes, or struggles to complete. I would start small here. One task is enough for a first pilot.
Try these prompts:
“My team works in [function]. Which associated tasks have the highest observed Claude usage?”
“Separate the tasks in [function] into possible automation pilots and human-AI collaboration pilots.”
“Compare [role A], [role B], and [role C] in my team. Where would a small AI pilot have the clearest external evidence from the Index?”
8. For coaches and career advisors: make the AI and jobs conversation specific
The connector cannot tell someone whether their job is safe. It can replace a vague conversation about an entire profession with a closer look at the tasks inside it.
Try these prompts:
“Create a task-level AI profile for [profession]. What parts of the role appear most often in Claude usage?”
“Which tasks associated with [profession] are mainly augmented, automated, or absent from the Index data?”
“Based on the Index findings for [profession], what questions should someone ask when planning which AI skills to learn next?”
9. For investors: check whether a pitch matches observed AI use
The connector will not tell you whether a company is investable or how large its market is. It can help you check whether the task in the pitch appears in observed Claude usage and how people work with AI on it.
Try these prompts:
“This company sells [product] to [profession]. Do the tasks it targets appear in observed Claude usage?”
“For the task [task], what does the Index show about usage, automation, and augmentation?”
“Evaluate this claim using only the Economic Index: [paste claim]. Separate what the data supports, contradicts, or cannot answer.”
The Index can show whether the task has observed demand, but not whether the company checks out. For that, use this Amplifier: Company Due Diligence Brief. It checks a named company against registry records, web coverage, and public sentiment.
10. For journalists, researchers, and policymakers: build a sourced brief
This is closest to what the Economic Index was built for. You can compare occupations, tasks, and changes across releases, then ask Claude to show the underlying source for every figure.
Try these prompts:
“Build a sourced brief on how Claude is used for tasks associated with [profession or occupational group].”
“How has observed Claude usage for [task or occupation] changed across Economic Index releases? Flag any methodology changes that affect the comparison.”
“Compare [occupation A] and [occupation B] by task usage and automation versus augmentation. Include the period, denominator, and source for every number.”
For research that needs sources beyond Anthropic, I would pair this connector with the Grounded Web Research Amplifier. That way, you can compare what the Index shows with current reporting, research papers, policy documents, and industry data, then see where the sources agree or contradict each other.
A few things to understand before you trust a number
Keep these in mind when you use any of the prompts:
It measures Claude usage, not all AI usage. The data does not cover everything happening in ChatGPT, Gemini, Copilot, private systems, or specialist AI tools.
It measures tasks, not people’s job titles. A conversation mapped to a marketing manager’s task does not prove that a marketing manager started it.
Every percentage needs a date and denominator. Ask which dataset, period, geography, and Claude surface the number describes. The June 2026 report also introduced methodology changes that affect comparisons.
Usage is a signal, not market validation. High usage does not prove willingness to pay. Low usage does not automatically reveal an open market. Both are reasons to investigate further.
The question the data leaves with us
These ten examples are only starting points. Begin with the role or industry you know best, then follow whatever surprises you. You may find something useful for your work, or you may simply enjoy looking through the data if you’re a data geek like me.
The Index can show how people are using Claude today. It cannot decide which parts of the work we should automate or where we want human judgment to remain. It gives us evidence to bring into that conversation.
If you explore the Index, leave a comment and tell me what you looked up and what you found.
And if this made you think of someone else’s role, share the post with them. I’d love to see what questions they ask too.
This post is free. Paid subscribers get Amplifiers PRO, weekly premium articles, all premium resources inside the AI blew my mind Lab, and exclusive partner discounts. Upgrade here.
I wasn't sure if I would get numbers on AI companionship, but I did, and an article will be coming soon! Thanks, Daria!!
The interesting part is that this data can be useful even if you are not trying to predict job loss.
Knowing which tasks are already being automated vs augmented can help you decide what to learn, what to build, and even which workflows are worth experimenting with.